Key Points
- CXR is an insensitive test for the diagnosis of COVID-1915 with the most common finding being bilateral/multilobar, asymmetric patchy or diffuse airspace opacities6,7,14,15
- Sensitivity of CT chest ranges between 70-97% when compared to PCR testing,1,8 though sensitivity decreases significantly early in disease10
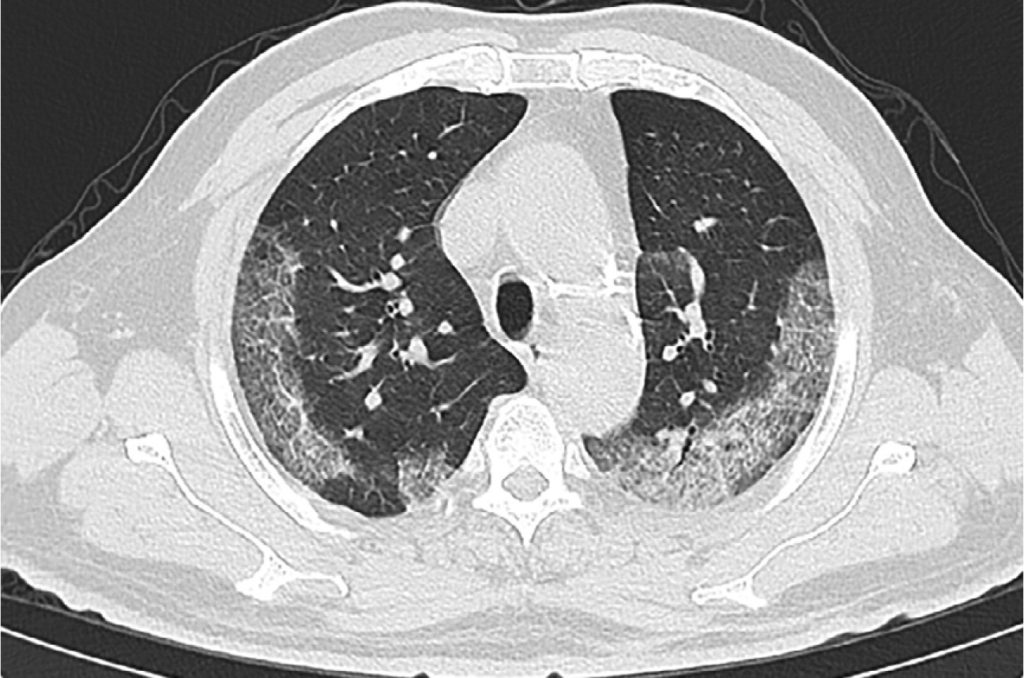
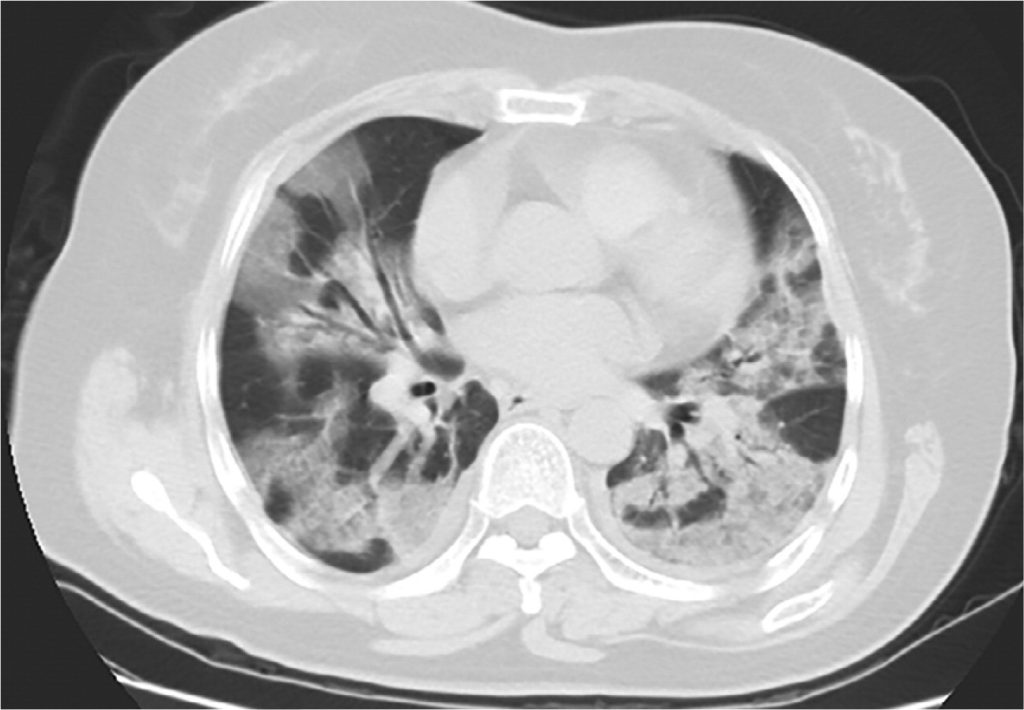
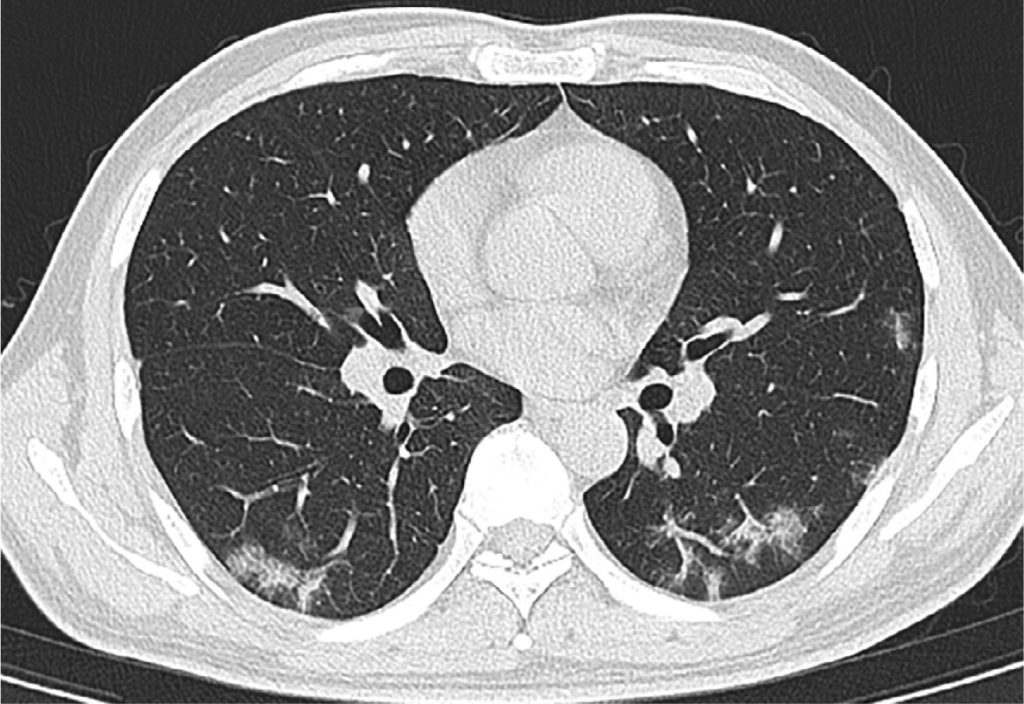
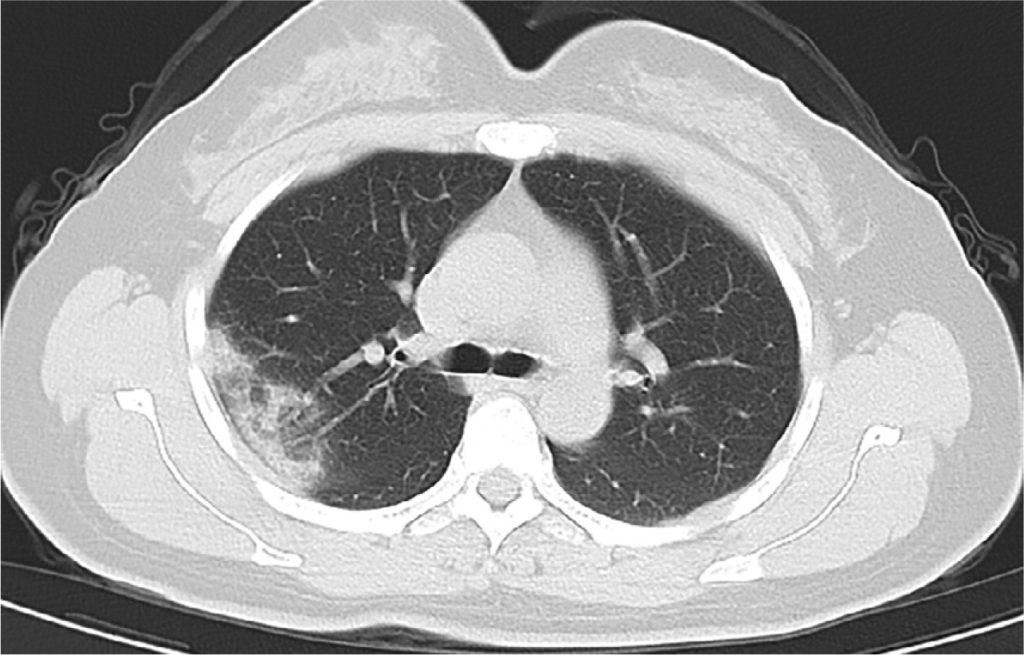
- The most common imaging findings on chest CT are that of atypical or organizing pneumonia14 predominantly with bilateral (50-75%), peripheral, and basal predominant distribution (IMAGES 1-4)10
- Pleural effusion, extensive tiny lung nodules, and lymphadenopathy occur in a very small number of cases and suggest bacterial superinfection or another diagnosis10
- With disease progression, crazy paving and consolidation become dominant, peaking around 9-13 days followed by slow clearance at ~1 month (FIGURES 1-2)10
Imaging has been an important part of determining suspicion for COVID-19 with CXR and Chest CT being the two modalities most commonly used. However, chest X-ray as a diagnostic tool for COVID-19 is limited, with 18% of patients having a normal CXR at mild/early disease.15 This does decrease to 3% in those with severe disease, with the most common findings being bilateral/multilobar, asymmetric patchy or diffuse airspace opacities. 6,7,14,15
Chest CT, on the other hand, has shown promise as a diagnostic tool and given delays and initial reports of high false negative rates in PCR testing (ranging from 60-95%)10, some countries have employed early chest CT to help triage and isolate early disease.11 Sensitivity of chest CT has ranged between 70-97% when compared to PCR testing,1,8 though there is data to suggest that there are limitations to CT diagnosis especially in those with early/minimal symptoms. One study showed up to 17% of patients had a negative CT on presentation11 with 50% of patients having a normal CT scan 0-2 days after symptom onset.10
The most common imaging findings on chest CT are that of atypical or organizing pneumonia14 predominantly with bilateral (50-75%), peripheral, and basal predominant distribution (IMAGES 1-4).10 There can also be multiple, discrete areas of ground-glass opacity, consolidation, or both, often with round morphology or a reversed halo or atoll sign.10 Pleural effusion, extensive tiny lung nodules, and lymphadenopathy occur in a very small number of cases and suggest bacterial superinfection or another diagnosis.10 As the disease progresses, crazy paving and consolidation become dominant, peaking around 9-13 days followed by slow clearance at ~1 month (FIGURES 1-2).10


References
- Ai T, Yang Z, Hou H, et al. Correlation of Chest CT and RT-PCR Testing in Coronavirus Disease 2019 (COVID-19) in China: A Report of 1014 Cases. Radiology. 2020:200642.
- Cardiology ACo. Cardiologist’s Insights From Treating COVID-19 Patients in China. American College of Cardiology. ACC News Story Web site. Published 2020. Accessed 3/12/2020, 2020.
- Medicine AIoUi. Guidelines for Cleaning and Preparing External- and Internal-Use Ultrasound Transducers Between Patients & Safe Handling and Use of Ultrasound Coupling Gel. American Institute of Ultrasound in Medicine. Published 2018. Accessed 05/16/2017, 2017.
- Echocardiography ASo. ASE Statement on COVID-19. American Society of Echocardiography. Published 2020. Accessed2020.
- Buonsenso D, Piano A, Raffaelli F, Bonadia N, de Gaetano Donati K, Franceschi F. Point-of-Care Lung Ultrasound findings in novel coronavirus disease-19 pnemoniae: a case report and potential applications during COVID-19 outbreak. Eur Rev Med Pharmacol Sci. 2020;24(5):2776-2780.
- Chen N, Zhou M, Dong X, et al. Epidemiological and clinical characteristics of 99 cases of 2019 novel coronavirus pneumonia in Wuhan, China: a descriptive study. Lancet. 2020;395(10223):507-513.
- Chung M, Bernheim A, Mei X, et al. CT Imaging Features of 2019 Novel Coronavirus (2019-nCoV). Radiology. 2020;295(1):202-207.
- Fang Y, Zhang H, Xie J, et al. Sensitivity of Chest CT for COVID-19: Comparison to RT-PCR. Radiology. 2020:200432.
- Felker GM, Boehmer JP, Hruban RH, et al. Echocardiographic findings in fulminant and acute myocarditis. J Am Coll Cardiol. 2000;36(1):227-232.
- Kanne JP, Little BP, Chung JH, Elicker BM, Ketai LH. Essentials for Radiologists on COVID-19: An Update-. Radiology. 2020:200527.
- Kenny J-E, Canepa C. An Illustrated Guide to the Chest CT in COVID-19. PulmCCM. Published 2020. Accessed2020.
- COVID-19 Preparedness for Echo Labs: Insights from the Frontlines. Youtube: American Society of Echocardiography; 2020.
- Ling Z, Xu X, Gan Q, et al. Asymptomatic SARS-CoV-2 infected patients with persistent negative CT findings. Eur J Radiol. 2020;126:108956.
- Murphy A, Bell D. COVID-19. Radiopaedia. Published 2020. Accessed2020.
- JCL R, Hare S, Edey A, et al. An update on COVID-19 for the radiologist – A British society of Thoracic Imaging statement. In. Clinical Radiology: Elsevier; 2020.
Kieran Leong, DO